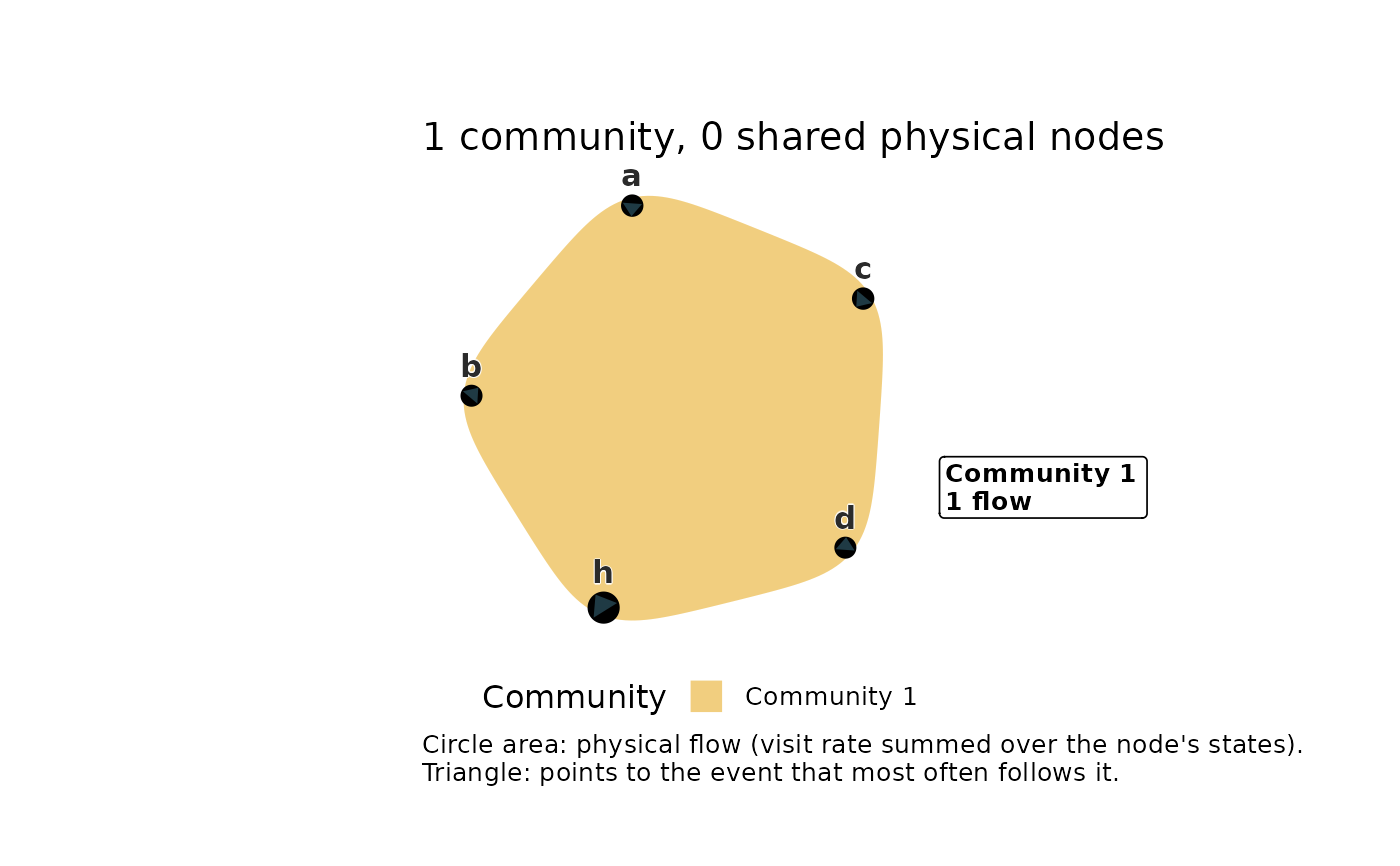
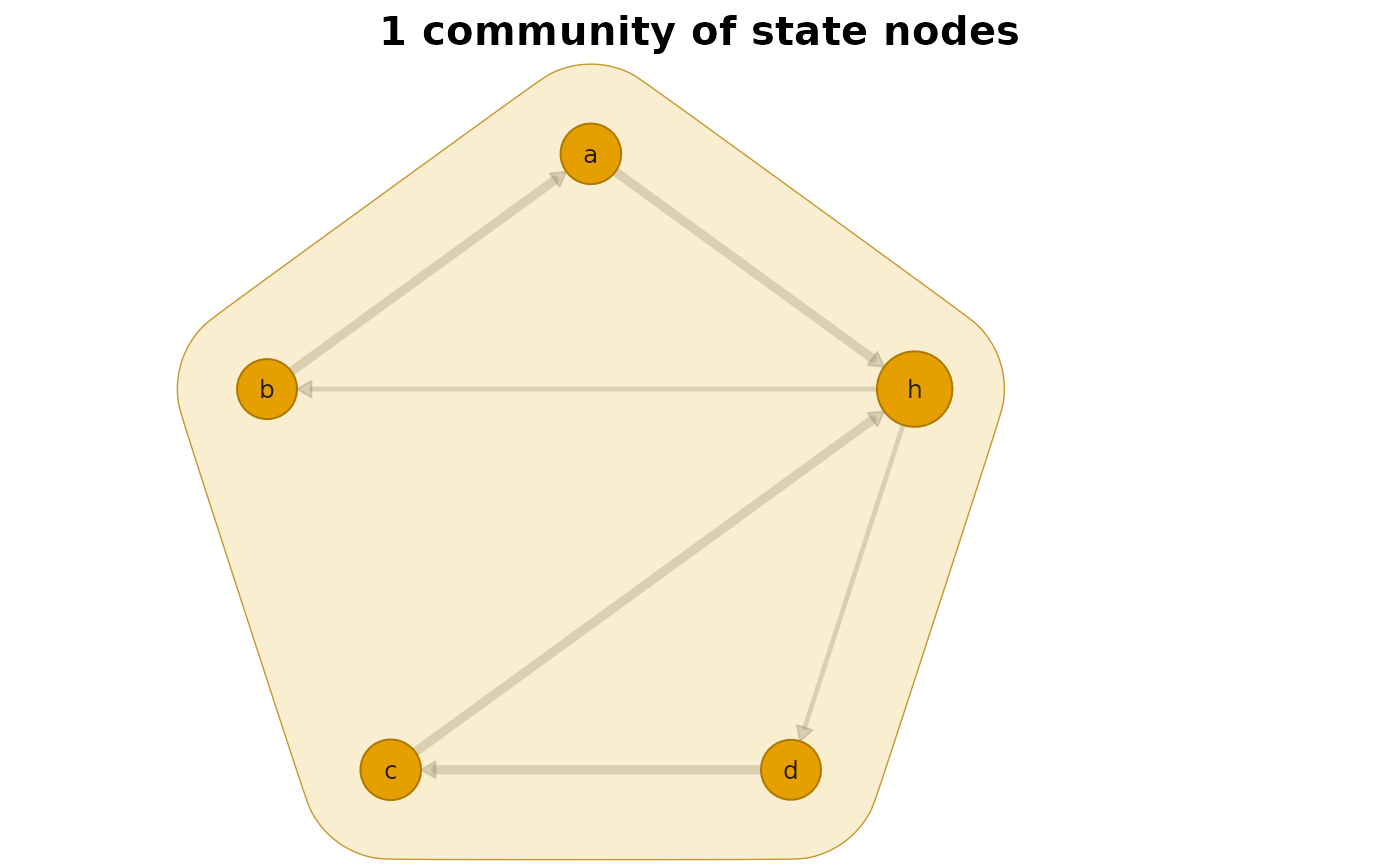
type = "physical"(default)every community is drawn as a pebble around the physical nodes it holds, through
plot.net_hg()on the community hypergraph (member = physical node, group ="Community k", fromhg_get(x, what = "physical")). A physical node shared by several communities lies inside each of their pebbles. Pebbles are coloured by community (Okabe-Ito, legend "Community"). Each node is a black circle whose area follows its physical flow (the memory network's visit rate summed over its state nodes), and a triangle inside the circle points at the physical node its link flow most often goes to next. Each community has a title box with its name and flow (the visit rate of its state nodes) beside its pebble, drawn byplot.net_hg()(haloed labels, legend below, wide margins); the boxes sit a little further out than there (title_gap = 0.14) to clear the labels of the nodes at a pebble's rim. A community holding a single physical node has no pebble of its own; its title box sits by the node and the caption names it.type = "states"the state nodes of the higher-order network, drawn by
cograph::overlay_communities(), one ring per community (cograph::layout_groups()), with community blobs, cograph's group legend, short state labels, and faded edges (transition probability below 0.05 hidden).
State nodes with zero flow (reached only by teleportation, see
hg_communities()) carry no physical flow and are never drawn in the
physical view; the state view leaves them and the singleton communities
they form out unless show_zero_flow = TRUE. A caption says how many were
left out. The tables returned by hg_get.net_hon_communities() are
unaffected.
Arguments
- x
A
net_hon_communitiesobject.- type
"physical"(default) or"states".- show_zero_flow
Draw zero-flow state nodes in the state view? Default
FALSE.- ...
For
type = "physical", passed toplot.net_hg()(e.g.seed,label_size,arrow_style = "outside",layout), overriding the defaults set here; fortype = "states", passed tocograph::overlay_communities()and on tocograph::splot().
Value
For type = "physical", a ggplot object (print it to draw). For
type = "states", x, invisibly (cograph draws with base graphics).
Conditions
hypernets_bad_input from plot.net_hg() for arguments passed
through ... that it rejects.